2020-11-20 22:36:51 +00:00
|
|
|
---
|
|
|
|
|
title: How to Setup Prometheus, Grafana and Loki on NixOS
|
|
|
|
|
date: 2020-11-20
|
|
|
|
|
tags:
|
|
|
|
|
- nixos
|
|
|
|
|
- prometheus
|
|
|
|
|
- grafana
|
|
|
|
|
- loki
|
|
|
|
|
- promtail
|
|
|
|
|
---
|
|
|
|
|
|
|
|
|
|
# How to Setup Prometheus, Grafana and Loki on NixOS
|
|
|
|
|
|
|
|
|
|
When setting up services on your home network, sometimes you have questions
|
|
|
|
|
along the lines of "how do I know that things are working?". In this blogpost we
|
|
|
|
|
will go over a few tools that you can use to monitor and visualize your machine
|
|
|
|
|
state so you can answer that. Specifically we are going to use the following
|
|
|
|
|
tools to do this:
|
|
|
|
|
|
|
|
|
|
- [Grafana](https://grafana.com/) for creating pretty graphs and managing
|
|
|
|
|
alerts
|
|
|
|
|
- [Prometheus](https://prometheus.io/) for storing metrics and as a common
|
|
|
|
|
metrics format
|
|
|
|
|
- [Prometheus node_exporter](https://github.com/prometheus/node_exporter) for
|
|
|
|
|
deriving metrics from system state
|
|
|
|
|
- [Loki](https://grafana.com/oss/loki/) as a central log storage point
|
|
|
|
|
- [promtail](https://grafana.com/docs/loki/latest/clients/promtail/) to push
|
|
|
|
|
logs to Loki
|
|
|
|
|
|
|
|
|
|
Let's get going!
|
|
|
|
|
|
|
|
|
|
[Something to note: in here you might see domains using the `.pele` top-level
|
|
|
|
|
domain. This domain will likely not be available on your home network. See <a
|
|
|
|
|
href="/blog/series/site-to-site-wireguard">this series</a> on how to set up
|
|
|
|
|
something similar for your home network. If you don't have such a setup, replace
|
|
|
|
|
anything that ends in `.pele` with whatever you normally use for
|
|
|
|
|
this.](conversation://Mara/hacker)
|
|
|
|
|
|
|
|
|
|
## Grafana
|
|
|
|
|
|
|
|
|
|
Grafana is a service that handles graphing and alerting. It also has some nice
|
|
|
|
|
tools to create dashboards. Here we will be using it for a few main purposes:
|
|
|
|
|
|
|
|
|
|
- Exploring what metrics are available
|
|
|
|
|
- Reading system logs
|
|
|
|
|
- Making graphs and dashboards
|
|
|
|
|
- Creating alerts over metrics or lack of metrics
|
|
|
|
|
|
|
|
|
|
Let's configure Grafana on a machine. Open that machine's `configuration.nix` in
|
|
|
|
|
an editor and add the following to it:
|
|
|
|
|
|
|
|
|
|
```nix
|
|
|
|
|
# hosts/chrysalis/configuration.nix
|
|
|
|
|
{ config, pkgs, ... }: {
|
|
|
|
|
# grafana configuration
|
|
|
|
|
services.grafana = {
|
|
|
|
|
enable = true;
|
|
|
|
|
domain = "grafana.pele";
|
|
|
|
|
port = 2342;
|
|
|
|
|
addr = "127.0.0.1";
|
|
|
|
|
};
|
|
|
|
|
|
|
|
|
|
# nginx reverse proxy
|
2020-11-27 16:52:11 +00:00
|
|
|
services.nginx.virtualHosts.${config.services.grafana.domain} = {
|
2020-11-20 22:36:51 +00:00
|
|
|
locations."/" = {
|
|
|
|
|
proxyPass = "http://127.0.0.1:${toString config.services.grafana.port}";
|
|
|
|
|
proxyWebsockets = true;
|
|
|
|
|
};
|
|
|
|
|
};
|
|
|
|
|
}
|
|
|
|
|
```
|
|
|
|
|
|
|
|
|
|
[If you have a <a href="/blog/site-to-site-wireguard-part-3-2019-04-11">custom
|
|
|
|
|
TLS Certificate Authority</a>, you can set up HTTPS for this deployment. See <a
|
|
|
|
|
href="https://github.com/Xe/nixos-configs/blob/master/common/sites/grafana.akua.nix">here</a>
|
|
|
|
|
for an example of doing this. If this server is exposed to the internet, you can
|
|
|
|
|
use a certificate from <a
|
|
|
|
|
href="https://nixos.wiki/wiki/Nginx#TLS_reverse_proxy">Let's Encrypt</a> instead
|
|
|
|
|
of your own Certificate Authority.](conversation://Mara/hacker)
|
|
|
|
|
|
|
|
|
|
Then you will need to deploy it to your cluster with `nixops deploy`:
|
|
|
|
|
|
|
|
|
|
```console
|
|
|
|
|
$ nixops deploy -d home
|
|
|
|
|
```
|
|
|
|
|
|
|
|
|
|
Now open the Grafana server in your browser at http://grafana.pele and login
|
|
|
|
|
with the super secure default credentials of admin/admin. Grafana will ask you
|
|
|
|
|
to change your password. Please change it to something other than admin.
|
|
|
|
|
|
|
|
|
|
This is all of the setup we will do with Grafana for now. We will come back to
|
|
|
|
|
it later.
|
|
|
|
|
|
|
|
|
|
## Prometheus
|
|
|
|
|
|
|
|
|
|
> Prometheus was punished by the gods by giving the gift of knowledge to man. He
|
|
|
|
|
> was cast into the bowels of the earth and pecked by birds.
|
|
|
|
|
Oracle Turret, Portal 2
|
|
|
|
|
|
|
|
|
|
Prometheus is a service that reads metrics from other services, stores them and
|
|
|
|
|
allows you to search and aggregate them. Let's add it to our `configuration.nix`
|
|
|
|
|
file:
|
|
|
|
|
|
|
|
|
|
```nix
|
|
|
|
|
# hosts/chrysalis/configuration.nix
|
|
|
|
|
services.prometheus = {
|
|
|
|
|
enable = true;
|
|
|
|
|
port = 9001;
|
|
|
|
|
};
|
|
|
|
|
```
|
|
|
|
|
|
|
|
|
|
Now let's deploy this config to the cluster with `nixops deploy`:
|
|
|
|
|
|
|
|
|
|
```console
|
|
|
|
|
$ nixops deploy -d home
|
|
|
|
|
```
|
|
|
|
|
|
|
|
|
|
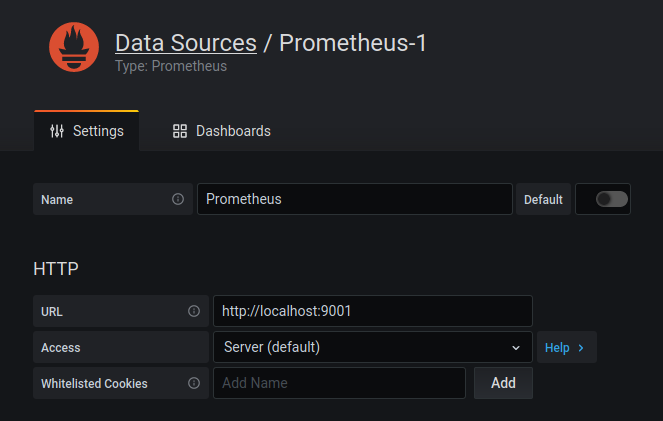
And let's configure Grafana to read from Prometheus. Open Grafana and click on
|
|
|
|
|
the gear to the left side of the page. The `Data Sources` tab should be active.
|
|
|
|
|
If it is not active, click on `Data Sources`. Then click "add data source" and
|
|
|
|
|
choose Prometheus. Set the URL to `http://127.0.0.1:9001` (or with whatever port
|
|
|
|
|
you configured above) and leave everything set to the default values. Click
|
|
|
|
|
"Save & Test". If there is an error, be sure to check the port number.
|
|
|
|
|
|
|
|
|
|
|
|
|
|
|
|
|
|
|
|
Now let's start getting some data into Prometheus with the node exporter.
|
|
|
|
|
|
|
|
|
|
### Node Exporter Setup
|
|
|
|
|
|
|
|
|
|
The Prometheus node exporter exposes a lot of information about systems ranging
|
|
|
|
|
from memory, disk usage and even systemd service information. There are also
|
|
|
|
|
some [other
|
|
|
|
|
collectors](https://search.nixos.org/options?channel=20.09&query=prometheus.exporters+enable)
|
|
|
|
|
you can set up based on your individual setup, however we are going to enable
|
|
|
|
|
only the node collector here.
|
|
|
|
|
|
|
|
|
|
In your `configuration.nix`, add an exporters block and configure the node
|
|
|
|
|
exporter under `services.prometheus`:
|
|
|
|
|
|
|
|
|
|
```nix
|
|
|
|
|
# hosts/chrysalis/configuration.nix
|
|
|
|
|
services.prometheus = {
|
|
|
|
|
exporters = {
|
|
|
|
|
node = {
|
|
|
|
|
enable = true;
|
|
|
|
|
enabledCollectors = [ "systemd" ];
|
2020-11-27 16:52:11 +00:00
|
|
|
port = 9002;
|
2020-11-20 22:36:51 +00:00
|
|
|
};
|
|
|
|
|
};
|
|
|
|
|
}
|
|
|
|
|
```
|
|
|
|
|
|
|
|
|
|
Now we need to configure Prometheus to read metrics from this exporter. In your
|
|
|
|
|
`configuration.nix`, add a `scrapeConfigs` block under `services.prometheus`
|
|
|
|
|
that points to the node exporter we configured just now:
|
|
|
|
|
|
|
|
|
|
```nix
|
|
|
|
|
# hosts/chrysalis/configuration.nix
|
|
|
|
|
services.prometheus = {
|
|
|
|
|
# ...
|
|
|
|
|
|
|
|
|
|
scrapeConfigs = [
|
|
|
|
|
{
|
|
|
|
|
job_name = "chrysalis";
|
2020-11-27 16:52:11 +00:00
|
|
|
static_configs = [{
|
2020-11-20 22:36:51 +00:00
|
|
|
targets = [ "127.0.0.1:${toString config.services.prometheus.exporters.node.port}" ];
|
2020-11-27 16:52:11 +00:00
|
|
|
}];
|
2020-11-20 22:36:51 +00:00
|
|
|
}
|
|
|
|
|
];
|
|
|
|
|
|
|
|
|
|
# ...
|
|
|
|
|
}
|
|
|
|
|
|
|
|
|
|
# ...
|
|
|
|
|
```
|
|
|
|
|
|
|
|
|
|
[The complicated expression in the target above allows you to change the port of
|
|
|
|
|
the node exporter and ensure that Prometheus will always be pointing at the
|
|
|
|
|
right port!](conversation://Mara/hacker)
|
|
|
|
|
|
|
|
|
|
Now we can deploy this to your cluster with nixops:
|
|
|
|
|
|
|
|
|
|
```console
|
|
|
|
|
$ nixops deploy -d home
|
|
|
|
|
```
|
|
|
|
|
|
|
|
|
|
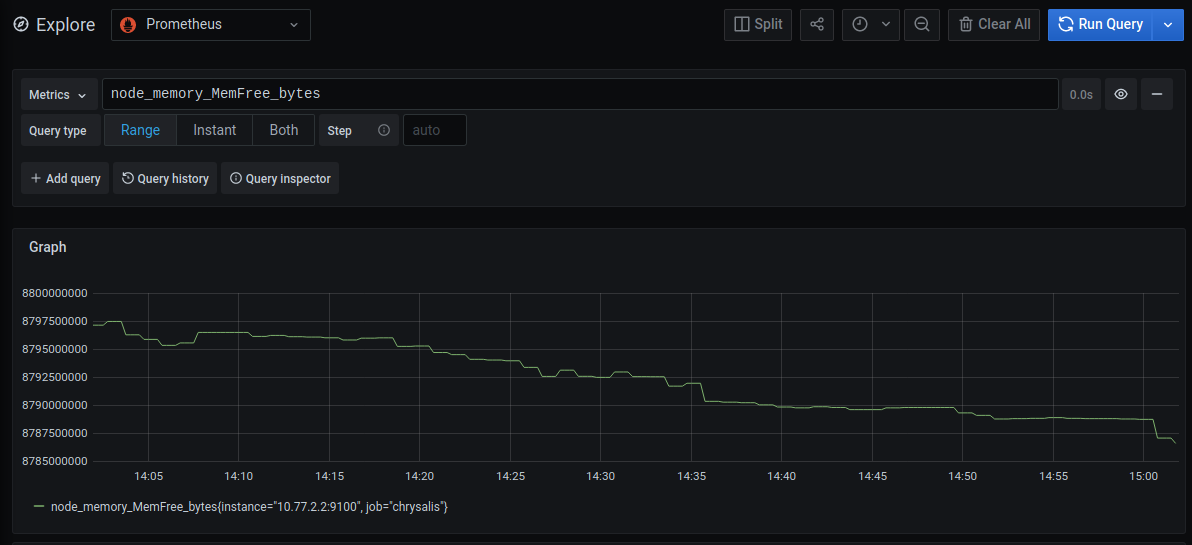
Open the Explore tab in Grafana and type in the following expression:
|
|
|
|
|
|
|
|
|
|
```
|
|
|
|
|
node_memory_MemFree_bytes
|
|
|
|
|
```
|
|
|
|
|
|
|
|
|
|
and hit shift-enter (or click the "Run Query" button in the upper left side of
|
|
|
|
|
the screen). You should see a graph showing you the amount of ram that is free
|
|
|
|
|
on the host, something like this:
|
|
|
|
|
|
|
|
|
|
|
|
|
|
|
|
|
|
|
|
If you want to query other fields, you can type in `node_` into the searchbox
|
|
|
|
|
and autocomplete will show what is available. For a full list of what is
|
|
|
|
|
available, open the node exporter metrics route in your browser and look through
|
|
|
|
|
it.
|
|
|
|
|
|
|
|
|
|
## Grafana Dashboards
|
|
|
|
|
|
|
|
|
|
Now that we have all of this information about our machine, let's create a
|
|
|
|
|
little dashboard for it and set up a few alerts.
|
|
|
|
|
|
|
|
|
|
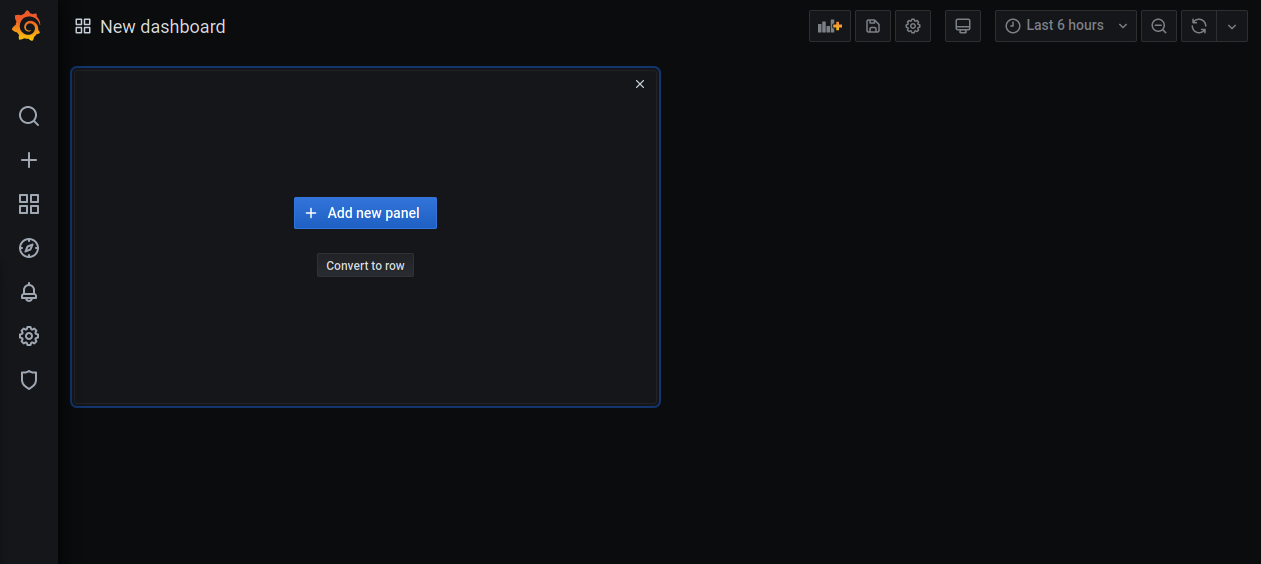
Click on the plus icon on the left side of the Grafana UI to create a new
|
|
|
|
|
dashboard. It will look something like this:
|
|
|
|
|
|
|
|
|
|
|
|
|
|
|
|
|
|
|
|
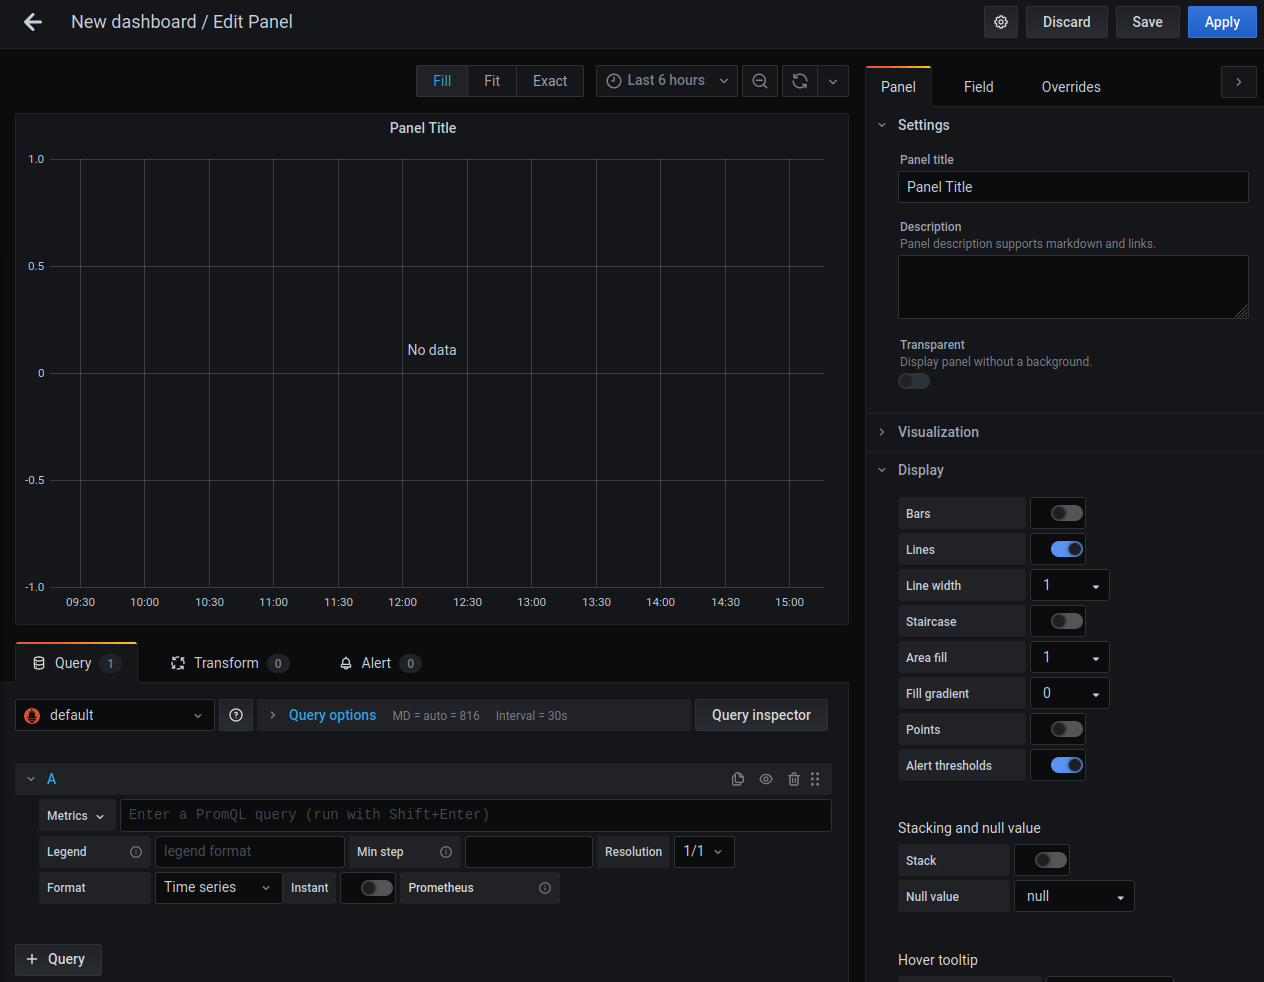
In Grafana terminology, everything you see in a dashboard is inside a panel.
|
|
|
|
|
Let's create a new panel to keep track of memory usage for our server. Click
|
|
|
|
|
"Add New Panel" and you will get a screen that looks like this:
|
|
|
|
|
|
|
|
|
|
|
|
|
|
|
|
|
|
|
|
Let's make this keep track of free memory. Write "Memory Free" in the panel
|
|
|
|
|
title field on the right. Write the following query in the textbox next to the
|
|
|
|
|
dropdown labeled "Metrics":
|
|
|
|
|
|
|
|
|
|
```
|
|
|
|
|
node_memory_MemFree_bytes
|
|
|
|
|
```
|
|
|
|
|
|
|
|
|
|
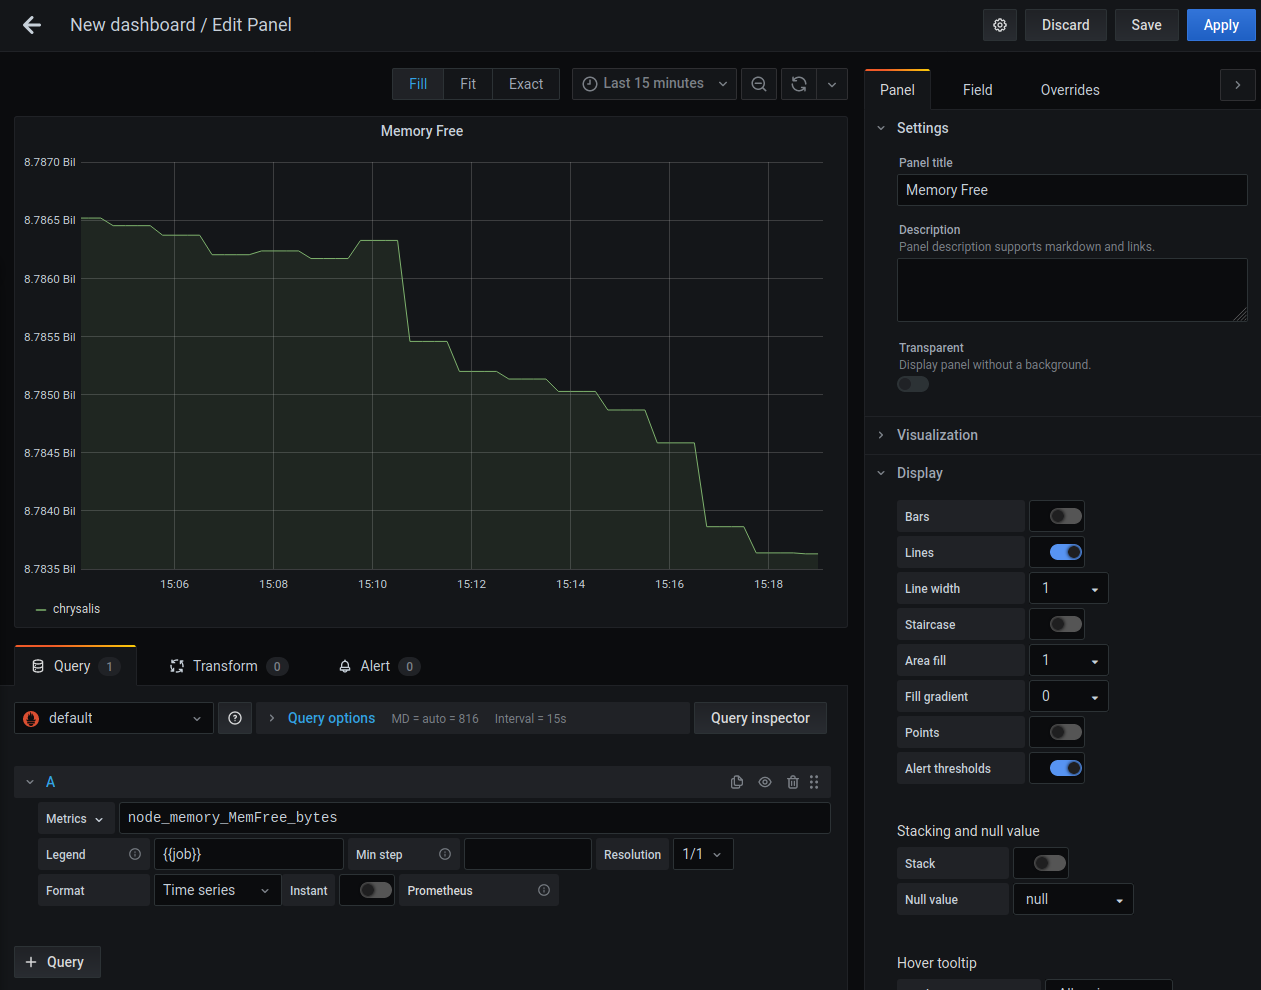
and set the legend to `{{job}}`. You should get a graph that looks something
|
|
|
|
|
like this:
|
|
|
|
|
|
|
|
|
|
|
|
|
|
|
|
|
|
|
|
This will show you how much memory is free on each machine you are monitoring
|
|
|
|
|
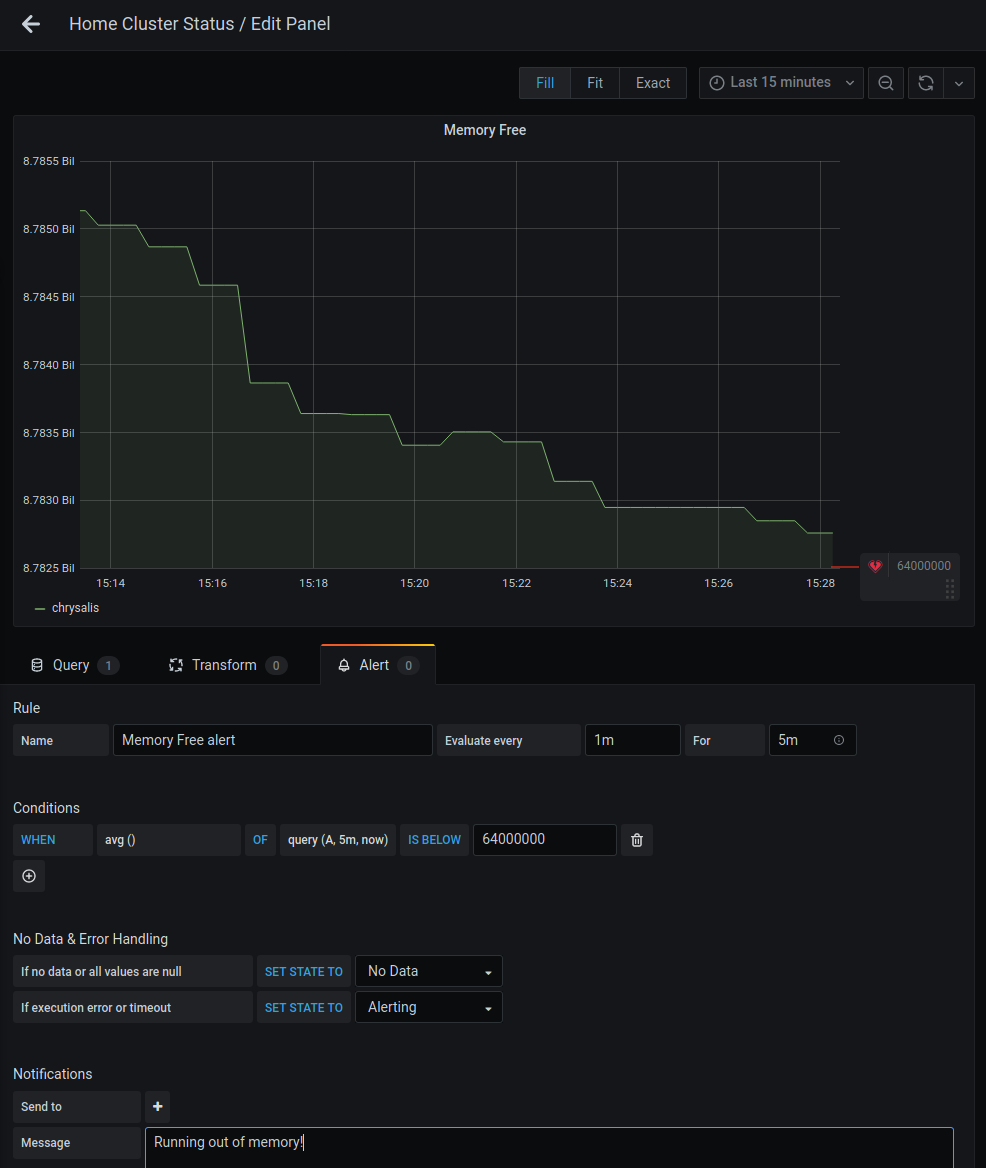
with Prometheus' node exporter. Now let's configure an alert for the amount of
|
|
|
|
|
free memory being low (where "low" means less than 64 megabytes of ram free).
|
|
|
|
|
|
|
|
|
|
Hit save in the upper right corner of the Grafana UI and give your dashboard a
|
|
|
|
|
name, such as "Home Cluster Status". Now open the "Memory Free" panel for
|
|
|
|
|
editing (click on the name and then click "Edit"), click the "Alert" tab, and
|
|
|
|
|
click the "Create Alert" button. Let's configure it to do the following:
|
|
|
|
|
|
|
|
|
|
- Check if free memory gets below 64 megabytes (64000000 bytes)
|
|
|
|
|
- Send the message "Running out of memory!" when the alert fires
|
|
|
|
|
|
|
|
|
|
You can do that with a configuration like this:
|
|
|
|
|
|
|
|
|
|
|
|
|
|
|
|
|
|
|
|
Save the changes to apply this config.
|
|
|
|
|
|
|
|
|
|
[Wait a minute. Where will this alert go to?](conversation://Mara/hmm)
|
|
|
|
|
|
|
|
|
|
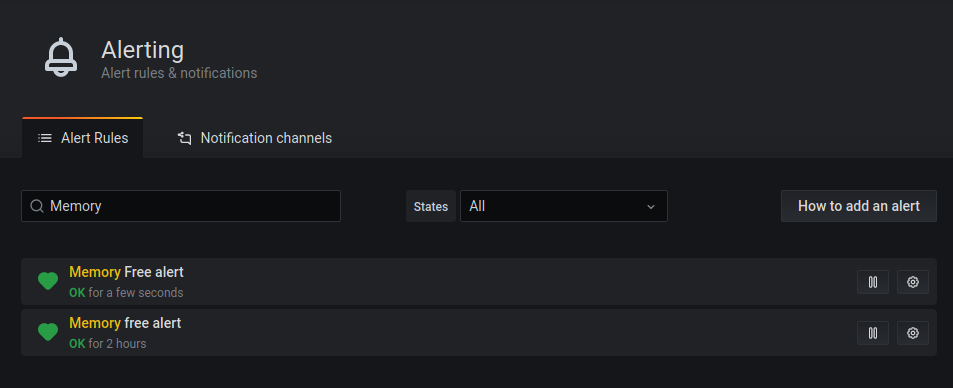
It will only show up on the alerts page:
|
|
|
|
|
|
|
|
|
|
|
|
|
|
|
|
|
|
|
|
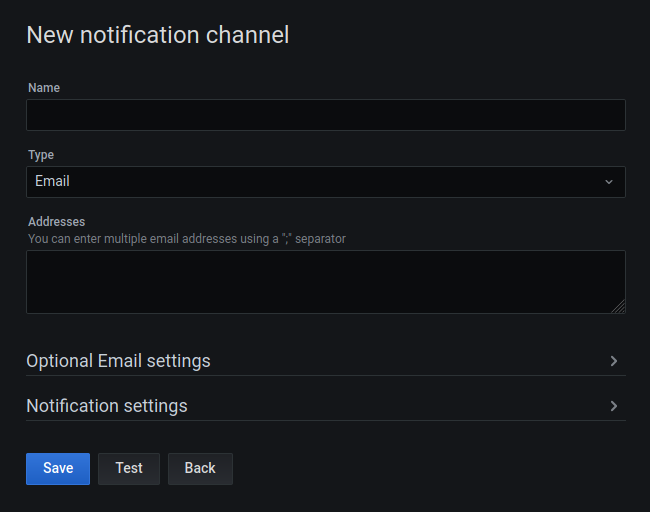
But we can add a notification channel to customize this. Click on the
|
|
|
|
|
Notification Channels tab and then click "New Channel". It should look something
|
|
|
|
|
like this:
|
|
|
|
|
|
|
|
|
|
|
|
|
|
|
|
|
|
|
|
You can send notifications to many services, but let's send one to Discord this
|
|
|
|
|
time. Acquire a Discord webhook link from somewhere and paste it in the Webhook
|
|
|
|
|
URL field. Name it something like "Discord". It may also be a good idea to make
|
|
|
|
|
this the default notification channel using the "Default" checkbox under the
|
|
|
|
|
Notification Settings, so that our existing alert will show up in Discord when
|
|
|
|
|
the system runs out of memory.
|
|
|
|
|
|
|
|
|
|
You can configure other alerts like this so you can monitor any other node
|
|
|
|
|
metrics you want.
|
|
|
|
|
|
|
|
|
|
[You can also monitor for the _lack_ of data on particular metrics. If something
|
|
|
|
|
that should always be reported suddenly isn't reported, it may be a good
|
|
|
|
|
indicator that a server went down. You can also add other services to your
|
|
|
|
|
`scrapeConfigs` settings so you can monitor things that expose metrics to
|
|
|
|
|
Prometheus at `/metrics`.](conversation://Mara/hacker)
|
|
|
|
|
|
|
|
|
|
Now that we have metrics configured, let's enable Loki for logging.
|
|
|
|
|
|
|
|
|
|
## Loki
|
|
|
|
|
|
|
|
|
|
Loki is a log aggregator created by the people behind Grafana. Here we will use
|
|
|
|
|
it as a target for all system logs. Unfortunately, the Loki NixOS module is very
|
|
|
|
|
basic at the moment, so we will need to configure it with our own custom yaml
|
|
|
|
|
file. Create a file in your `configuration.nix` folder called `loki.yaml` and
|
|
|
|
|
copy in the config from [this
|
|
|
|
|
gist](https://gist.github.com/Xe/c3c786b41ec2820725ee77a7af551225):
|
|
|
|
|
|
|
|
|
|
Then enable Loki with your config in your `configuration.nix` file:
|
|
|
|
|
|
|
|
|
|
```nix
|
|
|
|
|
# hosts/chrysalis/configuration.nix
|
|
|
|
|
services.loki = {
|
|
|
|
|
enable = true;
|
|
|
|
|
configFile = ./loki-local-config.yaml;
|
|
|
|
|
};
|
|
|
|
|
```
|
|
|
|
|
|
|
|
|
|
Promtail is a tool made by the Loki team that sends logs into Loki. Create a
|
|
|
|
|
file called `promtail.yaml` in the same folder as `configuration.nix` with the
|
|
|
|
|
following contents:
|
|
|
|
|
|
|
|
|
|
```yaml
|
|
|
|
|
server:
|
|
|
|
|
http_listen_port: 28183
|
|
|
|
|
grpc_listen_port: 0
|
|
|
|
|
|
|
|
|
|
positions:
|
|
|
|
|
filename: /tmp/positions.yaml
|
|
|
|
|
|
|
|
|
|
clients:
|
|
|
|
|
- url: http://127.0.0.1:3100/loki/api/v1/push
|
|
|
|
|
|
|
|
|
|
scrape_configs:
|
|
|
|
|
- job_name: journal
|
|
|
|
|
journal:
|
|
|
|
|
max_age: 12h
|
|
|
|
|
labels:
|
|
|
|
|
job: systemd-journal
|
|
|
|
|
host: chrysalis
|
|
|
|
|
relabel_configs:
|
|
|
|
|
- source_labels: ['__journal__systemd_unit']
|
|
|
|
|
target_label: 'unit'
|
|
|
|
|
```
|
|
|
|
|
|
|
|
|
|
Now we can add promtail to your `configuration.nix` by creating a systemd
|
|
|
|
|
service to run it with this snippet:
|
|
|
|
|
|
|
|
|
|
```nix
|
|
|
|
|
# hosts/chrysalis/configuration.nix
|
|
|
|
|
systemd.services.promtail = {
|
|
|
|
|
description = "Promtail service for Loki";
|
|
|
|
|
wantedBy = [ "multi-user.target" ];
|
|
|
|
|
|
|
|
|
|
serviceConfig = {
|
|
|
|
|
ExecStart = ''
|
|
|
|
|
${pkgs.grafana-loki}/bin/promtail --config.file ${./promtail.yaml}
|
|
|
|
|
'';
|
|
|
|
|
};
|
|
|
|
|
};
|
|
|
|
|
```
|
|
|
|
|
|
|
|
|
|
Now that you have this all set up, you can push this to your cluster with
|
|
|
|
|
nixops:
|
|
|
|
|
|
|
|
|
|
```console
|
|
|
|
|
$ nixops deploy -d home
|
|
|
|
|
```
|
|
|
|
|
|
|
|
|
|
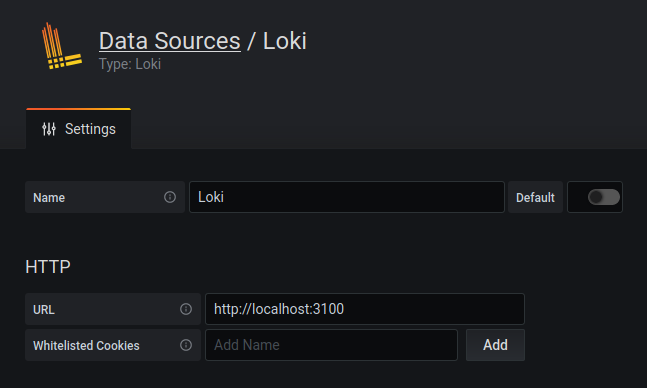
Once that finishes, open up Grafana and configure a new Loki data source with
|
|
|
|
|
the URL `http://127.0.0.1:3100`:
|
|
|
|
|
|
|
|
|
|
|
|
|
|
|
|
|
|
|
|
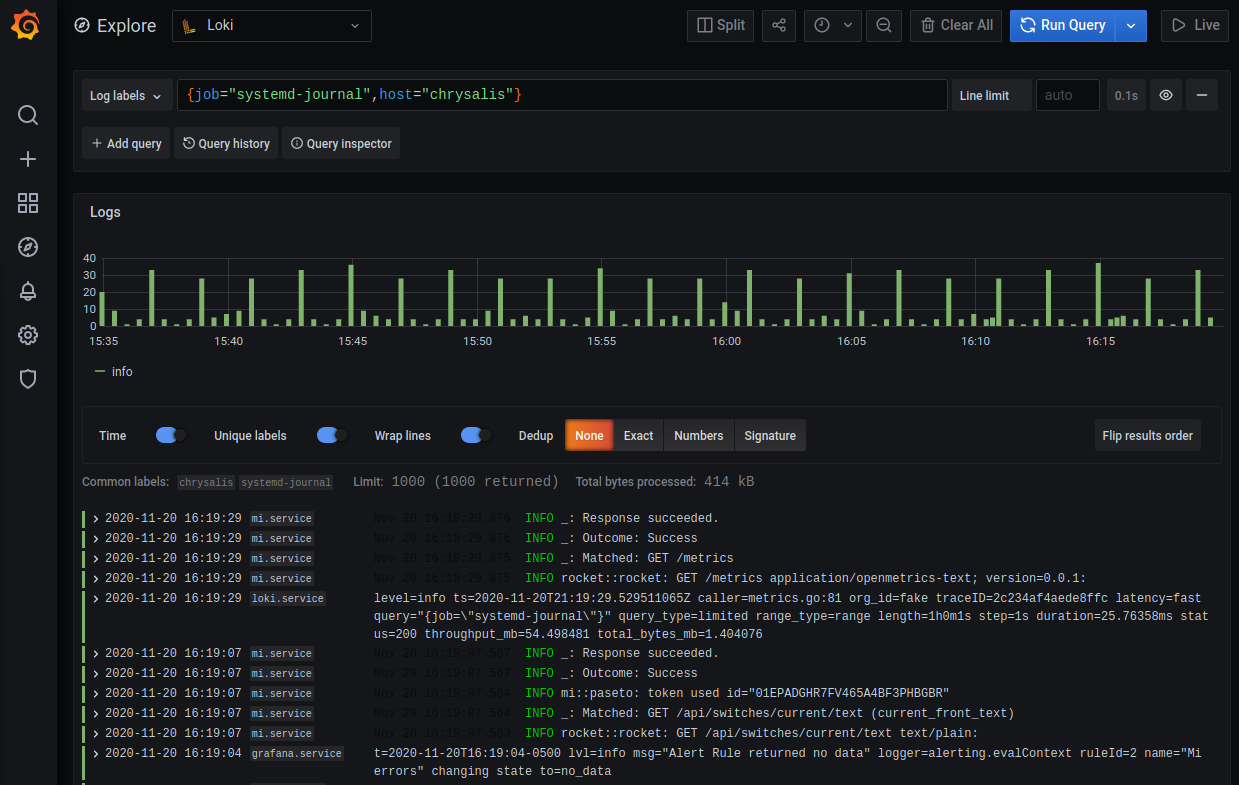
Now that you have Loki set up, let's query it! Open the Explore view in Grafana
|
|
|
|
|
again, choose Loki as the source, and enter in the query `{job="systemd-journal"}`:
|
|
|
|
|
|
|
|
|
|
|
|
|
|
|
|
|
|
|
|
[You can also add Loki queries like this to dashboards! Loki also lets you query by
|
|
|
|
|
systemd unit with the `unit` field. If you wanted to search for logs from
|
|
|
|
|
`foo.service`, you would need a query that looks something like
|
|
|
|
|
`{job="systemd-journal", unit="foo.service"}` You can do many more complicated
|
|
|
|
|
things with Loki. Look <a
|
|
|
|
|
href="https://grafana.com/docs/grafana/latest/datasources/loki/#search-expression">here
|
|
|
|
|
</a> for more information on what you can query. As of the time of writing this
|
|
|
|
|
blogpost, you are currently unable to make Grafana alerts based on Loki queries
|
|
|
|
|
as far as I am aware.](conversation://Mara/hacker)
|
|
|
|
|
|
|
|
|
|
---
|
|
|
|
|
|
|
|
|
|
This barely scrapes the surface of what you can accomplish with a setup like
|
|
|
|
|
this. Using more fancy setups you can alert on the rate of metrics changing. I
|
|
|
|
|
plan to make NixOS modules to make this setup easier in the future. There is
|
|
|
|
|
also a set of options in
|
|
|
|
|
[services.grafana.provision](https://search.nixos.org/options?channel=20.09&from=0&size=30&sort=relevance&query=grafana.provision)
|
|
|
|
|
that can make it easier to automagically set up Grafana with per-host
|
|
|
|
|
dashboards, alerts and all of the data sources that are outlined in this post.
|
|
|
|
|
|
|
|
|
|
The setup in this post is quite meager, but it should be enough to get you
|
|
|
|
|
started with whatever you need to monitor. Adding Prometheus metrics to your
|
|
|
|
|
services will go a long way in terms of being able to better monitor things in
|
|
|
|
|
production, do not be afraid to experiment!
|