---
title: How to Setup Prometheus, Grafana and Loki on NixOS
date: 2020-11-20
tags:
- nixos
- prometheus
- grafana
- loki
- promtail
---
When setting up services on your home network, sometimes you have questions
along the lines of "how do I know that things are working?". In this blogpost we
will go over a few tools that you can use to monitor and visualize your machine
state so you can answer that. Specifically we are going to use the following
tools to do this:
- [Grafana](https://grafana.com/) for creating pretty graphs and managing
alerts
- [Prometheus](https://prometheus.io/) for storing metrics and as a common
metrics format
- [Prometheus node_exporter](https://github.com/prometheus/node_exporter) for
deriving metrics from system state
- [Loki](https://grafana.com/oss/loki/) as a central log storage point
- [promtail](https://grafana.com/docs/loki/latest/clients/promtail/) to push
logs to Loki
Let's get going!
[Something to note: in here you might see domains using the `.pele` top-level
domain. This domain will likely not be available on your home network. See this series on how to set up
something similar for your home network. If you don't have such a setup, replace
anything that ends in `.pele` with whatever you normally use for
this.](conversation://Mara/hacker)
## Grafana
Grafana is a service that handles graphing and alerting. It also has some nice
tools to create dashboards. Here we will be using it for a few main purposes:
- Exploring what metrics are available
- Reading system logs
- Making graphs and dashboards
- Creating alerts over metrics or lack of metrics
Let's configure Grafana on a machine. Open that machine's `configuration.nix` in
an editor and add the following to it:
```nix
# hosts/chrysalis/configuration.nix
{ config, pkgs, ... }: {
# grafana configuration
services.grafana = {
enable = true;
domain = "grafana.pele";
port = 2342;
addr = "127.0.0.1";
};
# nginx reverse proxy
services.nginx.virtualHosts.${config.services.grafana.domain} = {
locations."/" = {
proxyPass = "http://127.0.0.1:${toString config.services.grafana.port}";
proxyWebsockets = true;
};
};
}
```
[If you have a custom
TLS Certificate Authority, you can set up HTTPS for this deployment. See here
for an example of doing this. If this server is exposed to the internet, you can
use a certificate from Let's Encrypt instead
of your own Certificate Authority.](conversation://Mara/hacker)
Then you will need to deploy it to your cluster with `nixops deploy`:
```console
$ nixops deploy -d home
```
Now open the Grafana server in your browser at http://grafana.pele and login
with the super secure default credentials of admin/admin. Grafana will ask you
to change your password. Please change it to something other than admin.
This is all of the setup we will do with Grafana for now. We will come back to
it later.
## Prometheus
> Prometheus was punished by the gods by giving the gift of knowledge to man. He
> was cast into the bowels of the earth and pecked by birds.
Oracle Turret, Portal 2
Prometheus is a service that reads metrics from other services, stores them and
allows you to search and aggregate them. Let's add it to our `configuration.nix`
file:
```nix
# hosts/chrysalis/configuration.nix
services.prometheus = {
enable = true;
port = 9001;
};
```
Now let's deploy this config to the cluster with `nixops deploy`:
```console
$ nixops deploy -d home
```
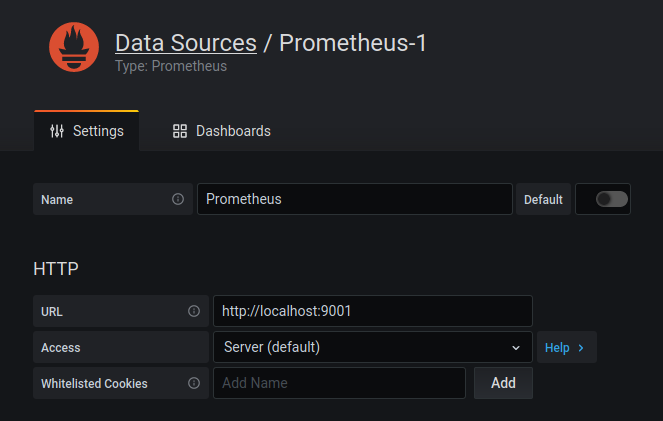
And let's configure Grafana to read from Prometheus. Open Grafana and click on
the gear to the left side of the page. The `Data Sources` tab should be active.
If it is not active, click on `Data Sources`. Then click "add data source" and
choose Prometheus. Set the URL to `http://127.0.0.1:9001` (or with whatever port
you configured above) and leave everything set to the default values. Click
"Save & Test". If there is an error, be sure to check the port number.
Now let's start getting some data into Prometheus with the node exporter.
### Node Exporter Setup
The Prometheus node exporter exposes a lot of information about systems ranging
from memory, disk usage and even systemd service information. There are also
some [other
collectors](https://search.nixos.org/options?channel=20.09&query=prometheus.exporters+enable)
you can set up based on your individual setup, however we are going to enable
only the node collector here.
In your `configuration.nix`, add an exporters block and configure the node
exporter under `services.prometheus`:
```nix
# hosts/chrysalis/configuration.nix
services.prometheus = {
exporters = {
node = {
enable = true;
enabledCollectors = [ "systemd" ];
port = 9002;
};
};
}
```
Now we need to configure Prometheus to read metrics from this exporter. In your
`configuration.nix`, add a `scrapeConfigs` block under `services.prometheus`
that points to the node exporter we configured just now:
```nix
# hosts/chrysalis/configuration.nix
services.prometheus = {
# ...
scrapeConfigs = [
{
job_name = "chrysalis";
static_configs = [{
targets = [ "127.0.0.1:${toString config.services.prometheus.exporters.node.port}" ];
}];
}
];
# ...
}
# ...
```
[The complicated expression in the target above allows you to change the port of
the node exporter and ensure that Prometheus will always be pointing at the
right port!](conversation://Mara/hacker)
Now we can deploy this to your cluster with nixops:
```console
$ nixops deploy -d home
```
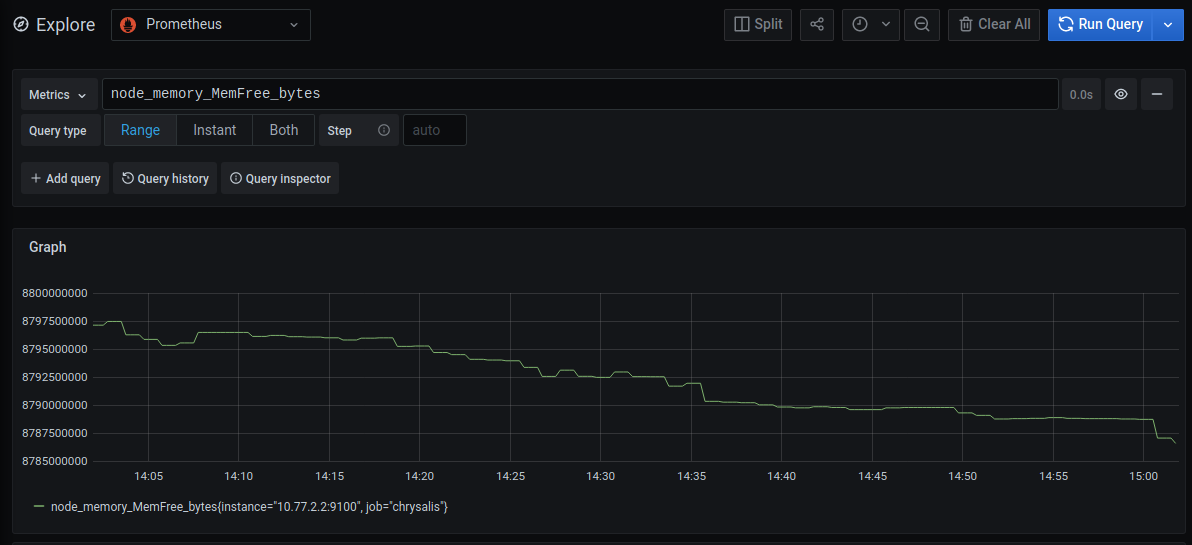
Open the Explore tab in Grafana and type in the following expression:
```
node_memory_MemFree_bytes
```
and hit shift-enter (or click the "Run Query" button in the upper left side of
the screen). You should see a graph showing you the amount of ram that is free
on the host, something like this:
If you want to query other fields, you can type in `node_` into the searchbox
and autocomplete will show what is available. For a full list of what is
available, open the node exporter metrics route in your browser and look through
it.
## Grafana Dashboards
Now that we have all of this information about our machine, let's create a
little dashboard for it and set up a few alerts.
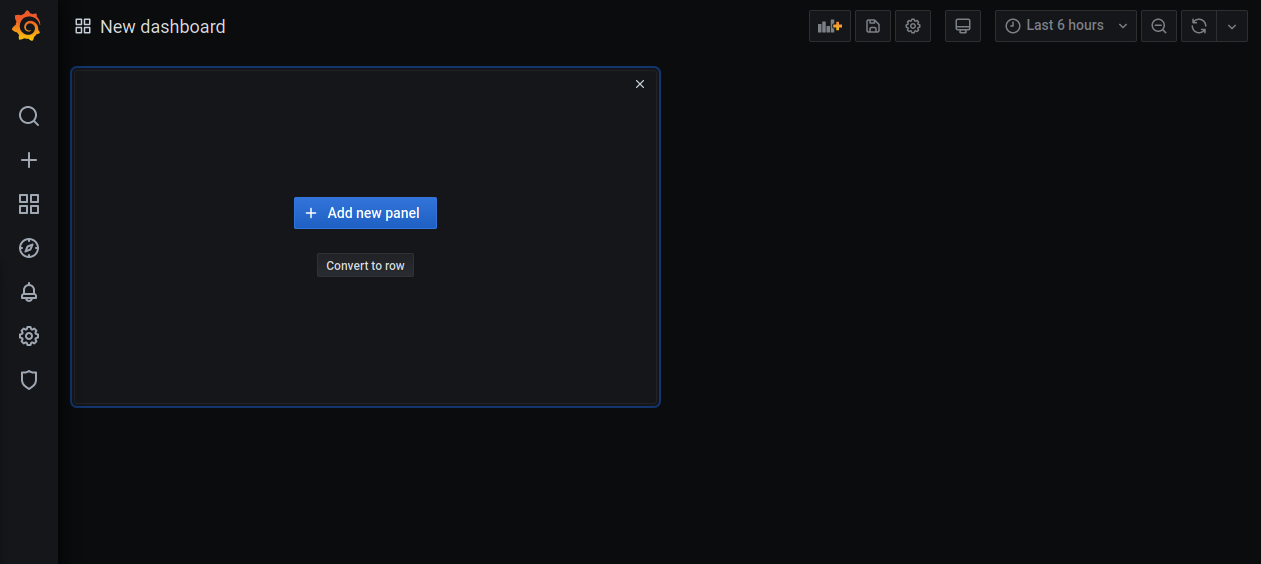
Click on the plus icon on the left side of the Grafana UI to create a new
dashboard. It will look something like this:
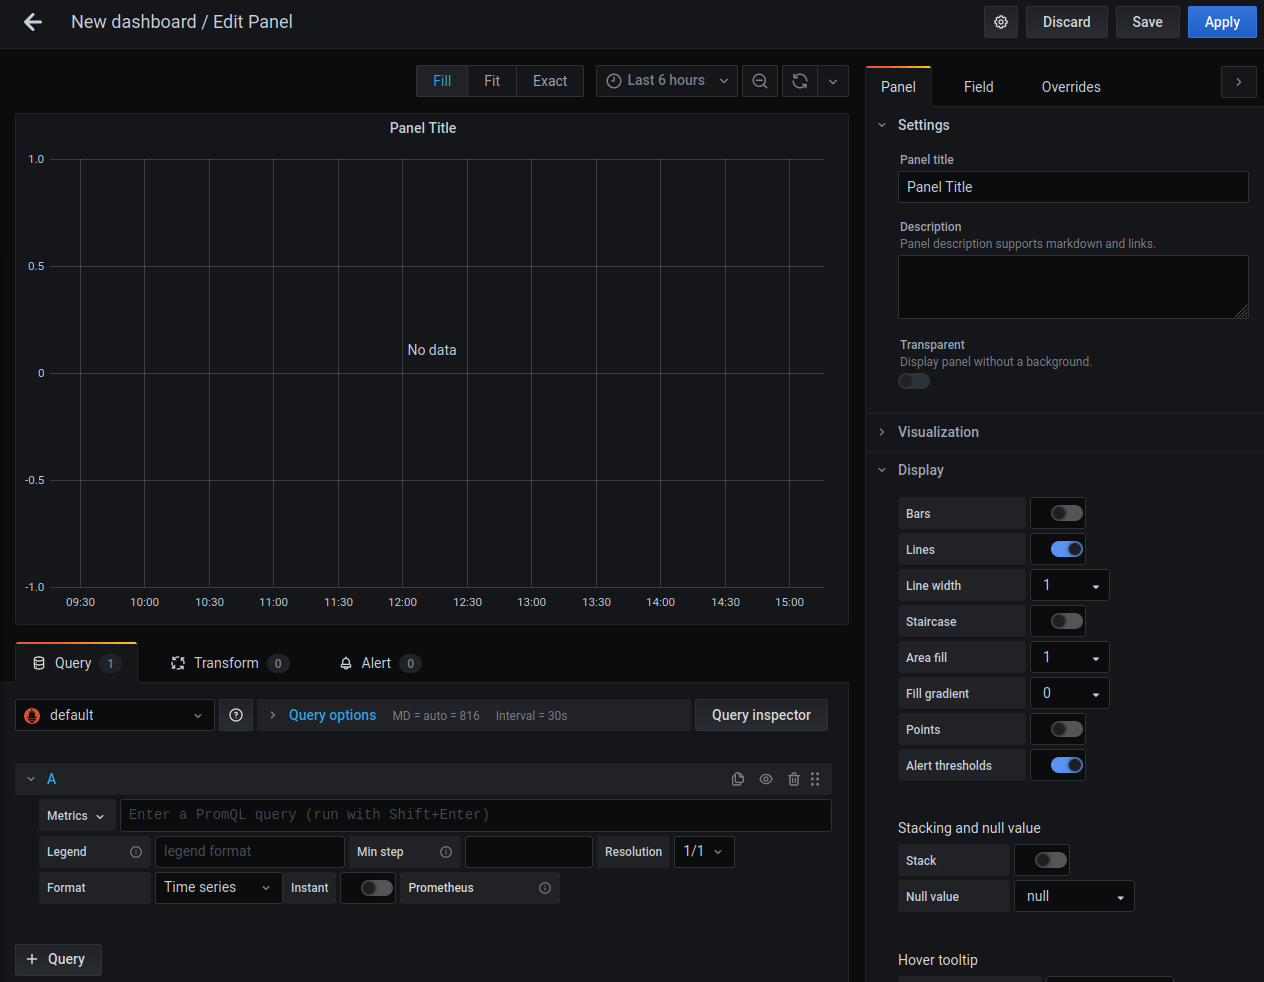
In Grafana terminology, everything you see in a dashboard is inside a panel.
Let's create a new panel to keep track of memory usage for our server. Click
"Add New Panel" and you will get a screen that looks like this:
Let's make this keep track of free memory. Write "Memory Free" in the panel
title field on the right. Write the following query in the textbox next to the
dropdown labeled "Metrics":
```
node_memory_MemFree_bytes
```
and set the legend to `{{job}}`. You should get a graph that looks something
like this:
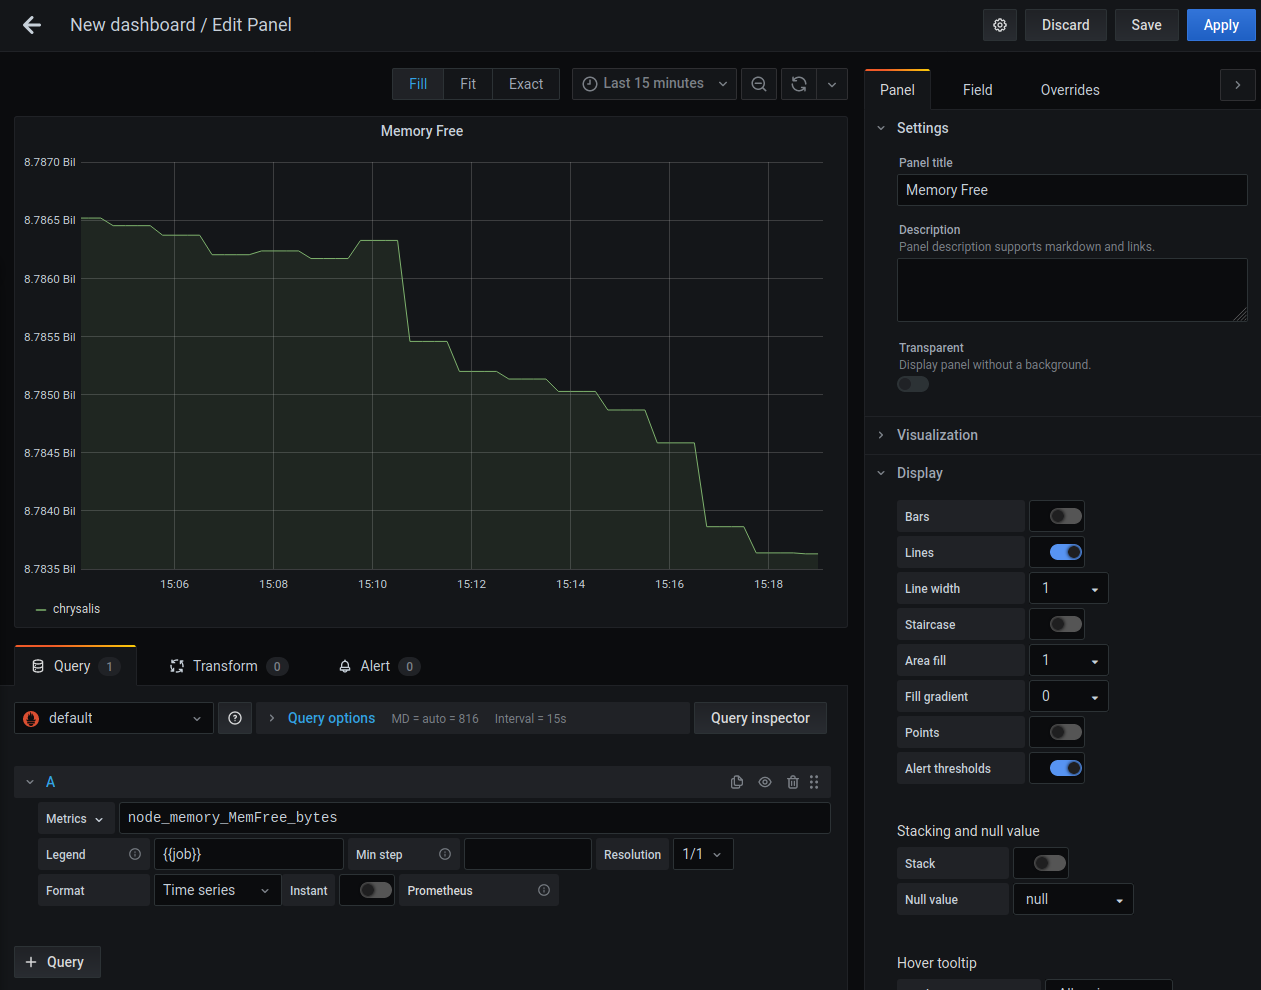
This will show you how much memory is free on each machine you are monitoring
with Prometheus' node exporter. Now let's configure an alert for the amount of
free memory being low (where "low" means less than 64 megabytes of ram free).
Hit save in the upper right corner of the Grafana UI and give your dashboard a
name, such as "Home Cluster Status". Now open the "Memory Free" panel for
editing (click on the name and then click "Edit"), click the "Alert" tab, and
click the "Create Alert" button. Let's configure it to do the following:
- Check if free memory gets below 64 megabytes (64000000 bytes)
- Send the message "Running out of memory!" when the alert fires
You can do that with a configuration like this:
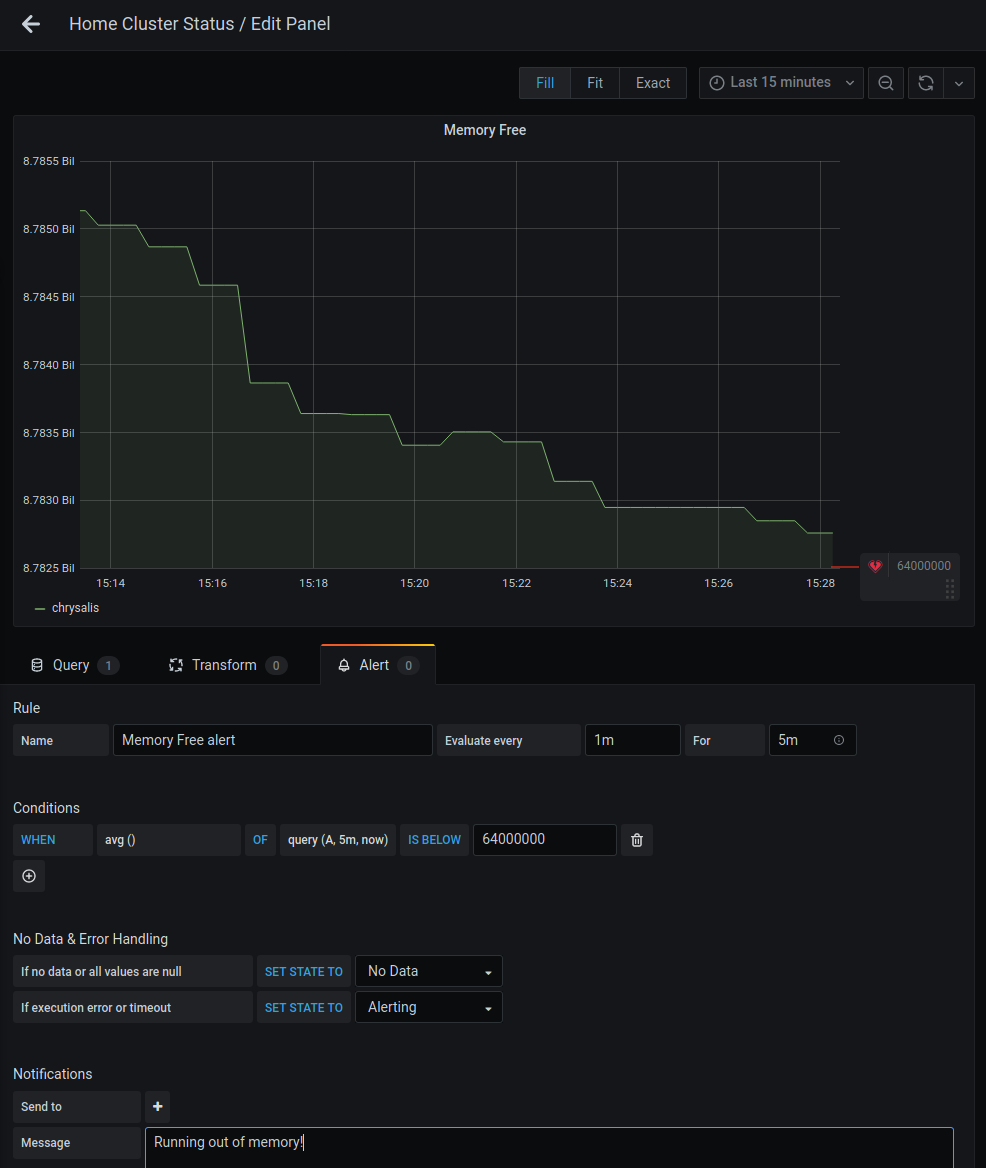
Save the changes to apply this config.
[Wait a minute. Where will this alert go to?](conversation://Mara/hmm)
It will only show up on the alerts page:
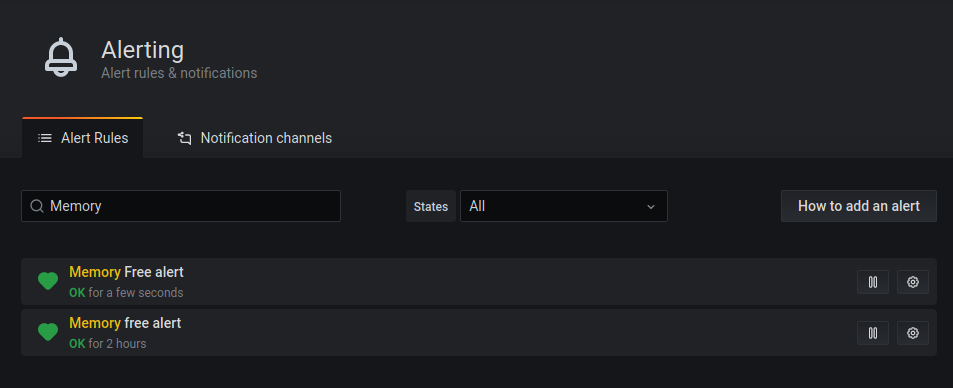
But we can add a notification channel to customize this. Click on the
Notification Channels tab and then click "New Channel". It should look something
like this:
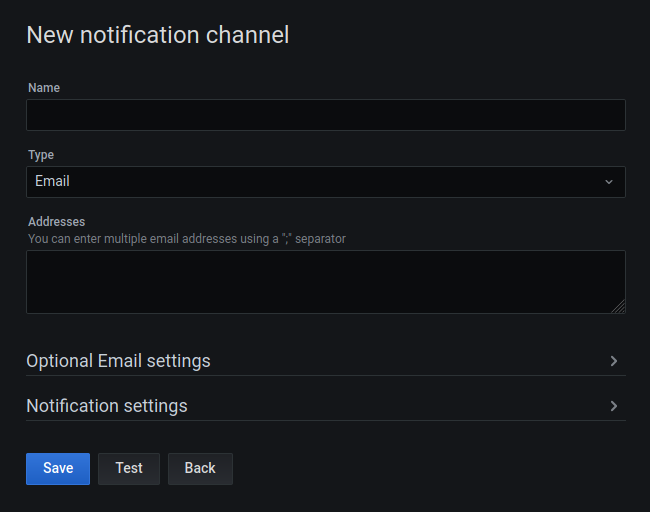
You can send notifications to many services, but let's send one to Discord this
time. Acquire a Discord webhook link from somewhere and paste it in the Webhook
URL field. Name it something like "Discord". It may also be a good idea to make
this the default notification channel using the "Default" checkbox under the
Notification Settings, so that our existing alert will show up in Discord when
the system runs out of memory.
You can configure other alerts like this so you can monitor any other node
metrics you want.
[You can also monitor for the _lack_ of data on particular metrics. If something
that should always be reported suddenly isn't reported, it may be a good
indicator that a server went down. You can also add other services to your
`scrapeConfigs` settings so you can monitor things that expose metrics to
Prometheus at `/metrics`.](conversation://Mara/hacker)
Now that we have metrics configured, let's enable Loki for logging.
## Loki
Loki is a log aggregator created by the people behind Grafana. Here we will use
it as a target for all system logs. Unfortunately, the Loki NixOS module is very
basic at the moment, so we will need to configure it with our own custom yaml
file. Create a file in your `configuration.nix` folder called `loki.yaml` and
copy in the config from [this
gist](https://gist.github.com/Xe/c3c786b41ec2820725ee77a7af551225):
Then enable Loki with your config in your `configuration.nix` file:
```nix
# hosts/chrysalis/configuration.nix
services.loki = {
enable = true;
configFile = ./loki-local-config.yaml;
};
```
Promtail is a tool made by the Loki team that sends logs into Loki. Create a
file called `promtail.yaml` in the same folder as `configuration.nix` with the
following contents:
```yaml
server:
http_listen_port: 28183
grpc_listen_port: 0
positions:
filename: /tmp/positions.yaml
clients:
- url: http://127.0.0.1:3100/loki/api/v1/push
scrape_configs:
- job_name: journal
journal:
max_age: 12h
labels:
job: systemd-journal
host: chrysalis
relabel_configs:
- source_labels: ['__journal__systemd_unit']
target_label: 'unit'
```
Now we can add promtail to your `configuration.nix` by creating a systemd
service to run it with this snippet:
```nix
# hosts/chrysalis/configuration.nix
systemd.services.promtail = {
description = "Promtail service for Loki";
wantedBy = [ "multi-user.target" ];
serviceConfig = {
ExecStart = ''
${pkgs.grafana-loki}/bin/promtail --config.file ${./promtail.yaml}
'';
};
};
```
Now that you have this all set up, you can push this to your cluster with
nixops:
```console
$ nixops deploy -d home
```
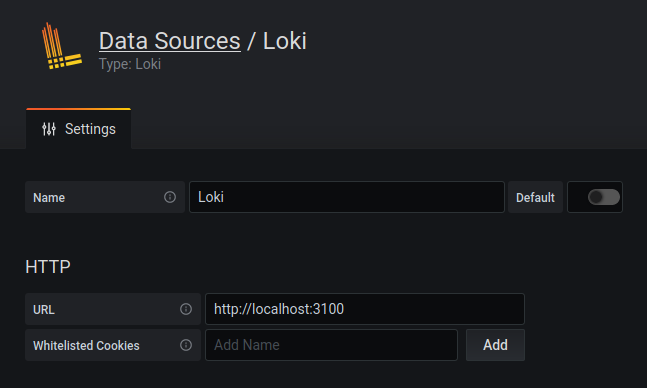
Once that finishes, open up Grafana and configure a new Loki data source with
the URL `http://127.0.0.1:3100`:
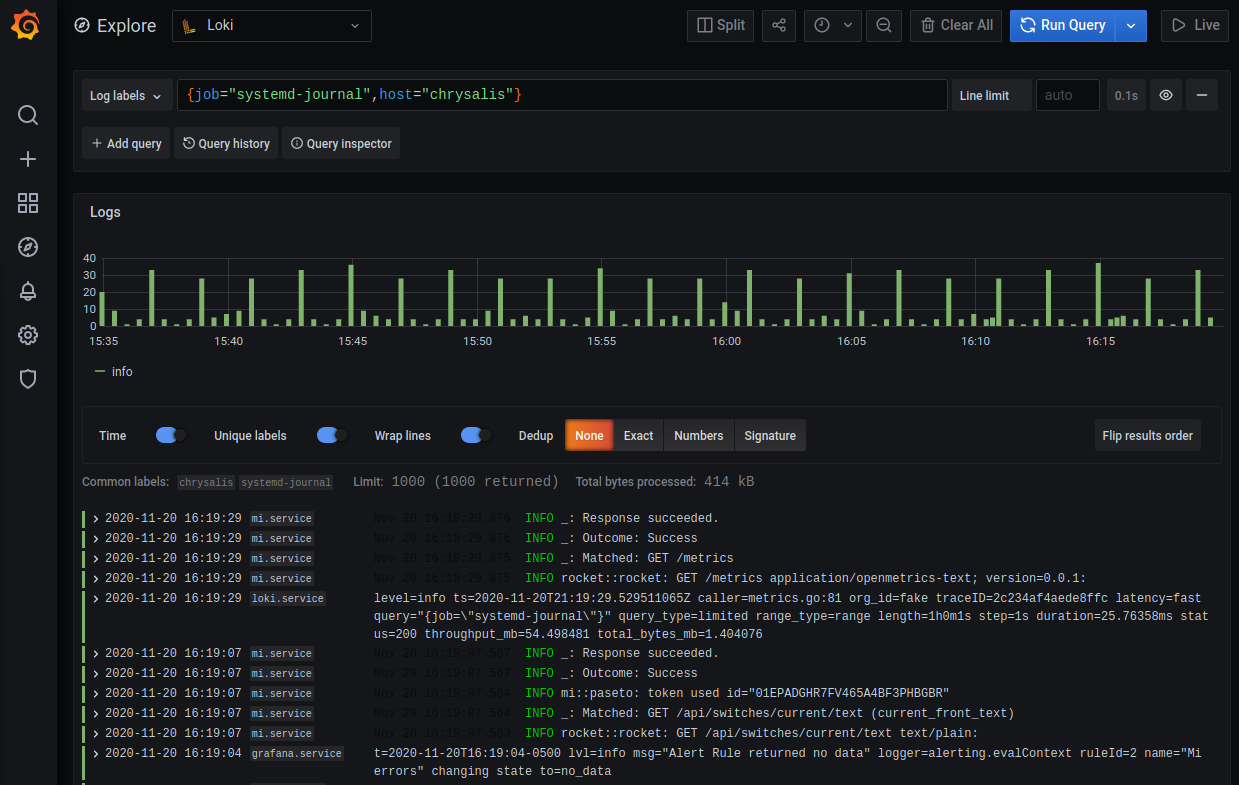
Now that you have Loki set up, let's query it! Open the Explore view in Grafana
again, choose Loki as the source, and enter in the query `{job="systemd-journal"}`:
[You can also add Loki queries like this to dashboards! Loki also lets you query by
systemd unit with the `unit` field. If you wanted to search for logs from
`foo.service`, you would need a query that looks something like
`{job="systemd-journal", unit="foo.service"}` You can do many more complicated
things with Loki. Look here
for more information on what you can query. As of the time of writing this
blogpost, you are currently unable to make Grafana alerts based on Loki queries
as far as I am aware.](conversation://Mara/hacker)
---
This barely scrapes the surface of what you can accomplish with a setup like
this. Using more fancy setups you can alert on the rate of metrics changing. I
plan to make NixOS modules to make this setup easier in the future. There is
also a set of options in
[services.grafana.provision](https://search.nixos.org/options?channel=20.09&from=0&size=30&sort=relevance&query=grafana.provision)
that can make it easier to automagically set up Grafana with per-host
dashboards, alerts and all of the data sources that are outlined in this post.
The setup in this post is quite meager, but it should be enough to get you
started with whatever you need to monitor. Adding Prometheus metrics to your
services will go a long way in terms of being able to better monitor things in
production, do not be afraid to experiment!